Monitor and Troubleshoot Connection Status of Splunk Federated Search with Cisco Security Analytics and Logging

This task enables you to monitor the integration status and troubleshoot connectivity issues between Splunk Federated Search and Cisco Security Analytics and Logging.

After the integration is complete, use this procedure to monitor and troubleshoot the connection status of Splunk Federated Search with Cisco Security Analytics and Logging.

Procedure


Choose Administration > Integrations > Splunk > Splunk Federated Search.

The table shows the sections displayed under the Splunk Federated Search tab after the integration is complete.
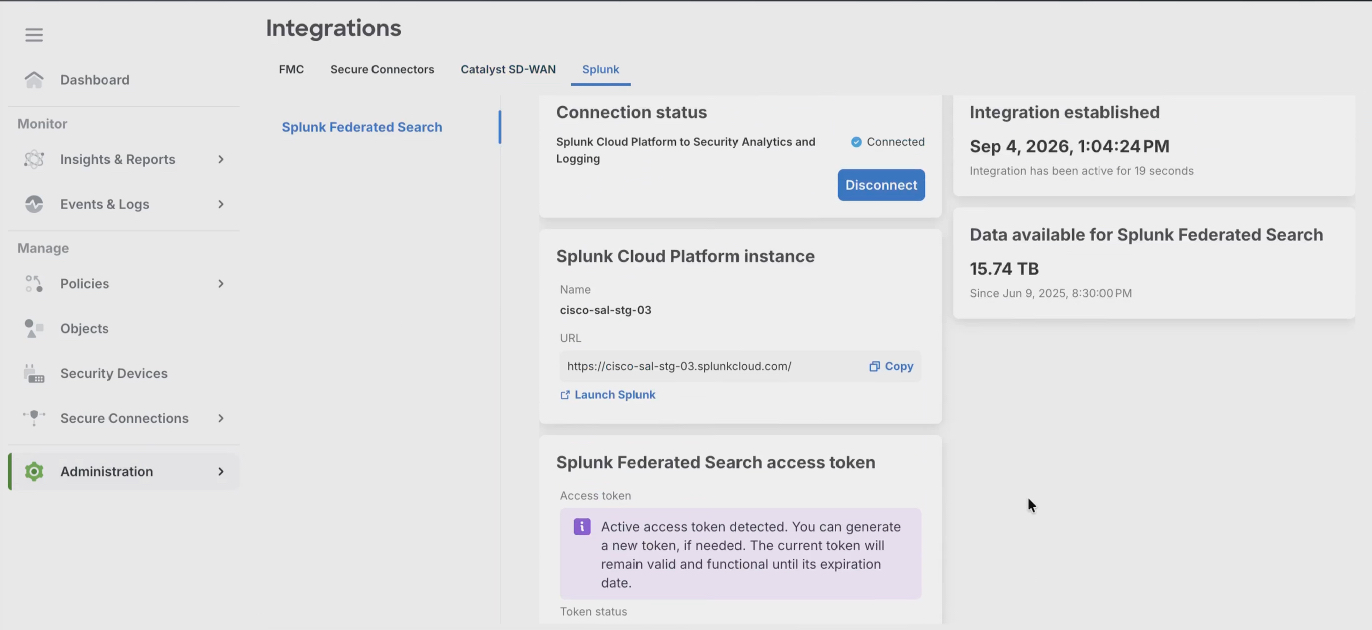
Screenshot of the Splunk Federated Search integrations page

Section

Description

Connection Status

Splunk to Security Analytics and Logging: Indicates the current state of connectivity between Splunk Cloud Platform and Cisco Security Analytics and Logging.

Integration established

The date and time at which the integration was completed, displayed in local time.

Splunk Cloud Platform instance

Name: Name of the Splunk Cloud instance.

URL: URL of the Splunk Cloud instance for federated search for Cisco Security Analytics and Logging.

Data available for Splunk Federated Search

Amount of data, typically measured in gigabytes (GB) or terabytes (TB), which can be queried with Splunk Federated Search.

Splunk Federated Search access token

  • Access token: If the access token is active, no access token is displayed here. Click Regenerate token if you still want to generate a new token.

    If you generate a new token, the current token will remain valid and functional until its expiration date.

  • Token status: Status of the access token. It can be either Active or Expired.

  • Generated by: Email address of the user who generated the access token.

  • Expires: Date and time when the access token expires.

Troubleshooting

  • What should I do if the connection status shows disconnected?

    If the connection status shows Disconnected, go back to the Integrations page to restart integration.

  • What should I do if the Splunk instance URL does not launch?

    If the Splunk instance URL does not launch, contact your Splunk administrator or Splunk Support.

  • The data available for Splunk Federated Search is zero. What should I do?

    If the data volume shows zero, it means no data is currently available for federated search. In such cases, you should verify whether the firewall events are flowing into the Events and Logs page in the Security Cloud Control platform. For existing customers, federated search up to 30 days of historical events. The actual period depends on the retention and onboarding configuration.


You can view the connection status, integration details, and troubleshoot any issues with the Splunk Federated Search integration.

What to do next:

Search Cisco Security Analytics and Logging event logs. For more information, see Search your Cisco Firewall datasets.