The Security Cloud Control Dashboard
The Security Cloud Control dashboard is your central hub for monitoring and managing tenant-level details across various categories. Upon logging in, you can access a customizable dashboard that offers critical insights and actions to optimize security and operational efficiency.
Customize Your Dashboard
Make your dashboard fit your specific needs by customizing the visible widgets.
-
On the Home page, click Customize.
-
Select or deselect the widgets you want to view on the dashboard.
-
You can drag and drop the widgets to arrange them as you prefer.
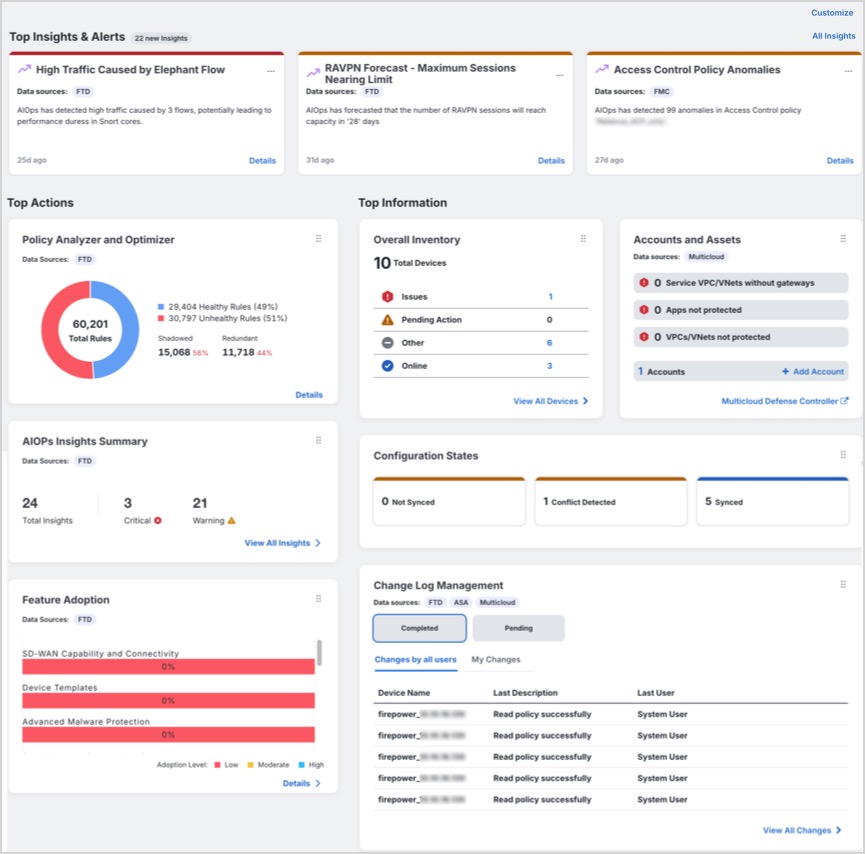
The dashboard is divided into three main sections: Top Insights & Alerts, Top Actions, and Top Information. Each section provides different categories of insights to help you maintain optimal security and operational control.
Top Insights & Alerts
This section is visible only if AIOps Insights is enabled for your tenant. You can view insights related to high traffic caused by elephant flows, RA VPN forecast, access control policy anomalies, high CPU and memory usage, snort CPU and memory usage.
Top Actions
This section is visible only if AIOps Insights is enabled for your tenant. If enabled, you can view the following widgets:
-
Policy Analyzer and Optimizer: Analyzes security policies, detects anomalies, and provides optimization recommendations to improve firewall performance.
For more information, see Policy Analyzer and Optimizer.
-
AIOps Insights: Offers detailed information on all active insights and trends, categorizing anomalies by Configuration, Health & Operations, or Traffic & Capacity.
For more information, see AIOps Insights.
-
Feature Adoption: Provides insights into feature adoption rates to optimize usage patterns and enhance security measures.
For more information, see Assess and Improve Feature Adoption.
Top Information
This section provides detailed insights into various tenant-level metrics. If enabled, you can view the following widgets:
-
Configuration States: Indicates the discrepancies between the configurations on your devices and those maintained by Security Cloud Control. This comparison helps identify any inconsistencies or conflicts that may exist.
For more information, see Device Management.
-
Change Log Management: Helps you to manage the change logs for precise operational control. The widget displays Completed and Pending change logs.
For more information, see Change Logs.
-
RA VPN Sessions: Helps you to monitor your Remote Access VPN sessions.
For more information, see RA VPN Sessions.
-
Overall Inventory: Helps you to monitor the health and status of all devices. The widget displays the total number of devices, categorized into Issues, Pending Actions, Other, and Online.
For more information, see All Devices.
-
Site-to-Site VPN: Helps you to manage and assess your site-to-site VPN connections. The widget displays the total number of VPN tunnels and the percentage that are Active and Idle.
For more information, see Site-to-site VPN.
-
Accounts and Assets:
-
Helps you to track and manage your multicloud accounts and resources effectively. You can launch the Multicloud Defense Controller from here.
-
Click +Add Account to add a new account.
For more information, see Multicloud Defense Controller.
-
-
Top Risky Destinations: Helps you identify and monitor the top risky destinations that are granted access. The widget lists Applications and URL Categories and allows you to filter data for the last 90, 60, or 30 days. You can filter between Allowed (default) and Blocked traffic.
-
Top Intrusion and Malware Events: Helps you to monitor and respond to top intrusion and malware events. The widget displays Intrusion Events and Malware Events and allows you to filter data for the last 90, 60, and 30 days. You can filter between Allowed (default) and Blocked events.
Announcements
Click the Announcements icon to look at the most recent Security Cloud Control features and updates. Links to related doucmentation is provided if you need more information on any of the items listed.