Policy analysis summary
The Summary tab includes the following rule information, presented in pie charts and bar graphs:
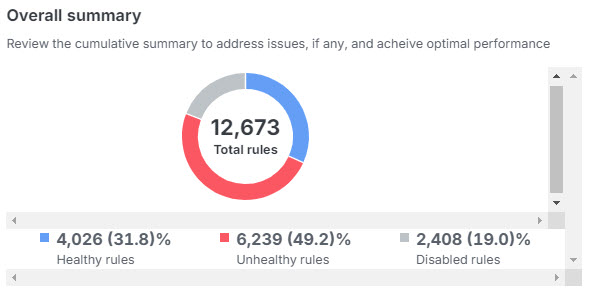
Overall summary—provides insights on how many rules are healthy, disabled, expired, and contain anomalies, using a pie chart. You can also hover over the part of the pie to view the percentage of rules.
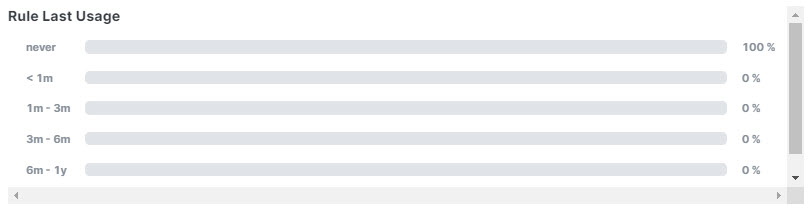
Rule usage history—provides insights on the recentness on the rule usage, with time periods.
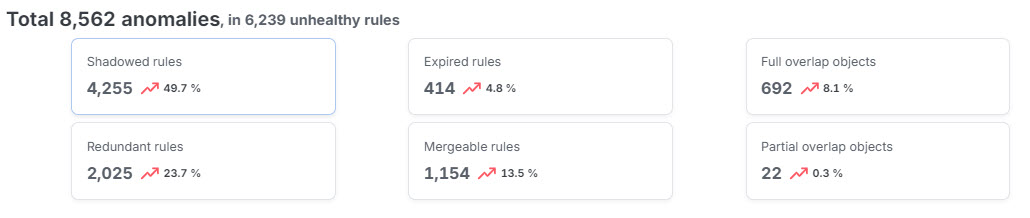
Rules with Anomalies—provides insights on how many rules have anomalies, using a bar graph. Hover over the bars to see the number of rules having anomalies.
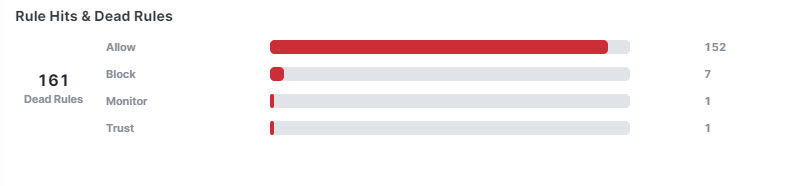
Hits rules & dead rules—provides insights on hitcount of expired rules, for rule types including allow, block, monitor, and trust.